What if I told you the way we’ve been measuring poverty for over 60 years is totally outdated? It’s like trying to use a 1960s map to get around today; you’d be lost.
That’s what the official poverty statistic does. It doesn’t take into account how expensive rent is in so many cities, or the food assistance that helps families get by. This old system hides the real picture of poverty in America.
But there’s a better way to look at it. And it shows something surprising: some of the wealthiest states actually have the highest levels of poverty. Poverty isn’t just about how much money you make, it’s about how fast your income gets eaten up by the cost of living.
So, let’s take a closer look at the real numbers and see where the economic struggle is hitting hardest. It’ll tell you why so many working families feel like they’re always falling behind, no matter how hard they work.
Contents
A Clearer Picture of Poverty in America
For years, the government has used something called the Official Poverty Measure (OPM), which was created back in the 1960s. It’s based on a simple formula: the cost of a basic food budget, multiplied by three.
But it only looks at pre-tax income and doesn’t take into account huge differences in living costs, like between Mississippi and California. It also leaves out important help families get, like tax credits and food assistance.
That’s where the Supplemental Poverty Measure (SPM) comes in. Created by the U.S. Census Bureau, the SPM gives us a much more accurate view. It starts with income, but then does two important things:
First, it adds in the value of non-cash benefits: things like food stamps (SNAP) and housing help. Second, it takes out unavoidable expenses like income taxes, work costs, and medical bills.
But perhaps most importantly, the SPM adjusts for the cost of housing in different areas. This change alone flips the map on its head, showing us a new, clearer picture of economic struggle in America. It doesn’t just tell us who’s poor, it helps us understand why they’re poor.
Mapping the States with the Highest Poverty
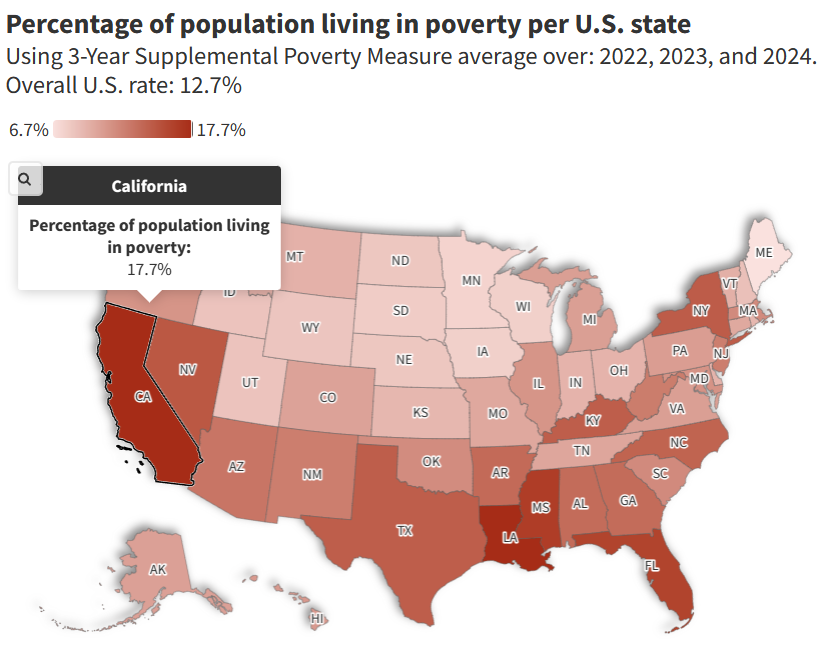
When we switch from the old poverty map to the new one, everything changes. Using the Supplemental Poverty Measure (SPM) and a 3-year average for better accuracy, we get a much clearer picture of where the financial squeeze is the hardest. Some of these states might surprise you.
Here are the five states with the highest poverty rates in the nation:
- California (17.7%)
- Louisiana (17.7%)
- Florida (16.1%)
- Mississippi (15.9%)
- New York (14.6%)
On the flip side, some states have much lower poverty rates. These states tend to have a mix of lower living costs, stronger safety nets, or different economic conditions.
Here are the five states with the lowest poverty rates:
- Maine (5.9%)
- Iowa (6.8%)
- Wisconsin (7.1%)
- New Hampshire (7.4%)
- Minnesota (7.4%)
This ranking tells the story of two very different types of poverty. One is driven by sky-high living costs, while the other is shaped by decades of low wages and deep systemic issues.
Also see: 6 Countries Where Americans Can Buy Property and Get Instant Residency
Why Are These the States with the Highest Poverty?
It might be surprising to see a state like California, home to Silicon Valley and Hollywood, at the top of the poverty list. But when we look through the lens of the Supplemental Poverty Measure (SPM), the reason becomes clear: even a decent income doesn’t go far when basic living costs are sky-high.
Let’s break down what’s really driving poverty in the hardest-hit states.
The High-Cost Crisis: California and Florida
In California, the story of poverty is a story about housing. Housing costs are the highest in the country, and they’ve grown much faster than wages for most families. In fact, one study found that if rent prices in California matched the national average, its poverty rate would drop dramatically.
Low-income families in the state spend about 82% of their income on essentials like rent, food, and transportation, leaving little to nothing left over. So even people with jobs can find themselves stuck in a cycle of barely getting by.
Florida tells a similar story, with a few key differences. Housing is expensive, wages are low, and the state has a weaker safety net.
Florida also relies heavily on sales taxes instead of income taxes. That means low-income residents pay a bigger chunk of their income in taxes compared to wealthier people, making it even harder for them to climb out of poverty.
Systemic Disadvantage: Mississippi and Louisiana
Poverty in Mississippi and Louisiana looks different from high-cost states like California, but it’s just as serious. Here, the issue isn’t sky-high rent or living expenses. It’s the lack of good-paying jobs and long-standing barriers that have kept communities from building wealth for generations.
In Mississippi, the economy is heavily built around low-wage industries. Many skilled workers leave the state in search of better opportunities, a trend often called “brain drain.”
On top of that, rural parts of the state face major gaps in access to basic needs: good jobs, public transportation, and even grocery stores. These “food deserts” make everyday life harder and keep families stuck in cycles of poverty that can last for generations.
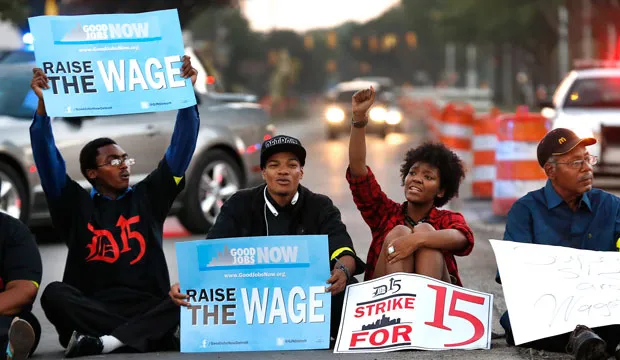
Louisiana faces many of the same struggles. The state has one of the biggest income gaps in the country, meaning the wealthiest and the poorest residents live worlds apart. Louisiana also still uses the federal minimum wage of $7.25 an hour, which simply isn’t enough to live on, especially for families.
Even though the cost of living is lower here than in other parts of the country, wages are so low that nearly half of all Black children in Louisiana live in poverty.
A Glimmer of Hope: What We Can Learn
States like Maine and Iowa, which have some of the lowest poverty rates in the country, aren’t without their problems. They still face challenges and inequalities. But there are a few key factors that help explain their better outcomes.
For one, the cost of living is generally lower, which makes it easier for families to get by. In some cases, these states also offer stronger local support programs, like food assistance and tax credits.
In Maine, for example, programs like SNAP and the Earned Income Tax Credit have played a big role in reducing child poverty.
The Real Face of Poverty in America
So what does poverty in America really look like? The truth is, it doesn’t have just one face.
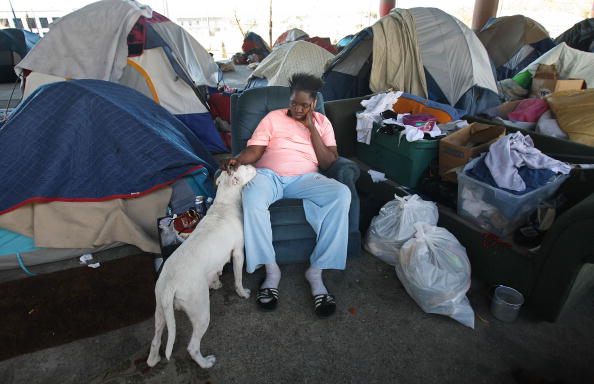
It’s the family in Los Angeles spending 70% of their income just to rent a small apartment. It’s the full-time worker in the Mississippi Delta who still can’t earn enough to feed her kids.
The Supplemental Poverty Measure helps us see these stories more clearly. It shows that economic hardship looks different across the country, and that where you live plays a huge role in how hard it is to get by.
But the most important thing the data tells us? Poverty is not inevitable; it’s a policy choice.
During the pandemic, when the Child Tax Credit was expanded, child poverty dropped by nearly half in just one year. When that policy ended, poverty more than doubled. That one shift proved something powerful: we already have the tools to reduce poverty.
We can choose to make life better for millions of families. The real question isn’t whether can we do it.
It’s: Will we?